Utah Breaking News, Sports and Weather


Latest News & Features

AI cybersecurity flaw: How hackers can fool AI chatbots into handing over sensitive info
Matt Gephardt, KSL | Posted June 23 - 11:14 p.m. | Save Story
We're used to hearing warnings about AI fooling people. But what happens when people fool AI chatbots?

Box Elder County commissioners who voted for data center project trailing in primary voting
Tim Vandenack, KSL | Posted June 23 - 10:36 p.m. | Save Story
Two Box Elder County commissioners who voted for a controversial data center project are trailing in primary voting in their reelection bids, according to early returns.

Co-owners of drug treatment facility accused of defrauding Utah Medicaid
Pat Reavy, KSL | Posted June 23 - 10:33 p.m. | Save Story
Three men have been charged under the Utah False Claims Act on the accusation that they billed Medicaid for drug treatment services never rendered.

University of Utah trustees greenlight creation of state's first AI bachelor's degree
Logan Stefanich, KSL | Posted June 23 - 9:40 p.m. | Save Story
The University of Utah is on track to offer a first-of-its-kind bachelor's degree program in artificial intelligence this fall.
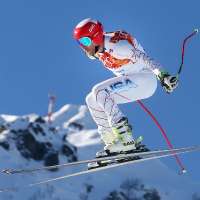
Olympian skier Bode Miller pleads not guilty to Idaho misdemeanor drug charges
Rebecca Boone, Associated Press | Updated June 23 - 9:14 p.m. | Save Story
Olympic gold medalist skier Bode Miller has pleaded not guilty to misdemeanor drug charges. An Idaho sheriff's deputy says Miller was arrested for possessing psilocybin mushrooms.

'Now is not the time to be careless with fires,' Gill warns
Pat Reavy, KSL | Posted June 23 - 8:30 p.m. | Save Story
Charges filed against man accused of starting Memory Grove fire as DA warns about reckless behavior with camp fires and fireworks during upcoming holidays.
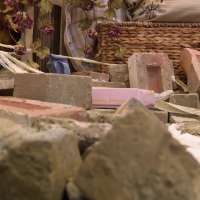
Car crashes into American Fork shop, forcing closure on Father's Day
Debbie Worthen, KSL | Posted June 23 - 8:00 p.m. | Save Story
A small Utah County business is closed until further notice after a car slammed through its storefront on Father's Day.

Utah mother charged with international kidnapping claims she was saving kids from 'end of times'
Cassidy Wixom, KSL | Posted June 23 - 7:40 p.m. | Save Story
A Utah mother, who believed she was saving her kids from "the end of times," is facing federal kidnapping charges after she fled to Croatia with her four children.

Leader of Texas immigration center attack gets 100-year prison sentence
Jasper Ward, Reuters | Updated June 23 - 7:20 p.m. | Save Story
Eight people were each sentenced to 30 to 100 years in prison on Tuesday in connection with violence at a Texas federal immigration facility last year that prosecutors called domestic terrorism.

Salt Lake City to begin requiring business licenses for short-term rentals
Carter Williams, KSL | Posted June 23 - 7:04 p.m. | Save Story
Utah's capital city is now cracking down on recent short-term rental challenges through an ordinance that will require business licenses to operate them.

Utah Jazz select Darryn Peterson with second pick in 2026 NBA Draft
Chandler Holt, KSL | Posted June 23 - 6:42 p.m. | Save Story
With the No. 2 overall pick in the 2026 NBA Draft, the Utah Jazz selected Kansas guard Darryn Peterson.

Pregnant teen murdered in 1975 identified as Cheryl Edwards of Illinois thanks to DNA genealogy
Sara Tenenbaum | Updated June 23 - 6:40 p.m. | Save Story
DNA testing identified a pregnant teen who was found murdered more than 50 years ago in Iowa as Cheryl Edwards, a girl who lived in Waukegan, Illinois.
Vernal foster mother to stand trial on child abuse homicide accusations, judge rules
Emily Ashcraft, KSL | Posted June 23 - 6:20 p.m. | Save Story
Angela Accuttoroop was scheduled for a 2027 jury trial for child abuse homicide on Thursday after a judge ruled there was enough evidence for her to stand trial.

Washington Wizards select AJ Dybantsa with first pick in 2026 NBA Draft
Chandler Holt, KSL | Posted June 23 - 6:13 p.m. | Save Story
With the No. 1 overall pick in the 2026 NBA Draft, the Washington Wizards selected BYU wing AJ Dybantsa.
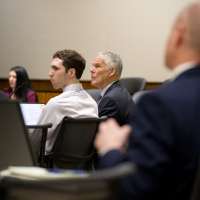
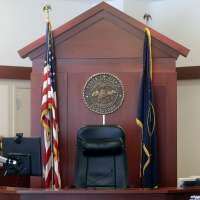
Tyler Robinson isn't first high profile case to allow cameras, media argues
Pat Reavy, KSL | Posted June 23 - 5:40 p.m. | Save Story
The battle over allowing electronic media coverage of the Tyler Robinson capital murder case continued with media attorneys filing their response to the Utah Supreme Court.

Senate joins House in voting to halt Iran war, rebuking Trump
Patricia Zengerle, Reuters | Updated June 23 - 5:20 p.m. | Save Story
The Republican-majority Senate backed legislation on Tuesday to halt military action against Iran, but it was not immediately clear how it would affect the war and ongoing peace negotiations.

Husband charged in 2006 death of wife in Angel's Landing fall
Pat Reavy, KSL | Updated June 23 - 5:15 p.m. | Save Story
Benadette Vander Meer fell to her death from Angel's Landing 20 years ago. On Tuesday, her husband was charged with murder and insurance fraud.
12-year-old Colorado City boy experiencing rare, life-threatening post-transplant condition
Arianne Brown, KSL | Posted June 23 - 5:00 p.m. | Save Story
Zachary Broadbent, 12, is facing a life-threatening condition that is puzzling doctors.

Human remains found in Garfield County nearly 30 years ago identified
Pat Reavy, KSL | Posted June 23 - 4:30 p.m. | Save Story
Forensic genetic genealogy testing has provided a breakthrough for investigators in a nearly three decade old cold case in Garfield County.
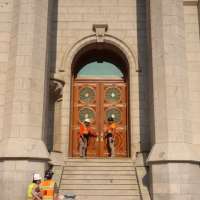
Salt Lake Temple marks milestone with reinstallation of east temple doors
Tamara Vaifanua, KSL | Posted June 23 - 4:02 p.m. | Save Story
The Salt Lake Temple reinstalled its east doors, which are set to open soon to the world in the largest open house The Church of Jesus Christ of Latter-day Saints has hosted.
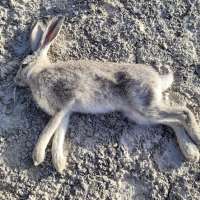
A highly infectious disease has been found in Utah's wild rabbit population again
Carter Williams, KSL | Posted June 23 - 3:45 p.m. | Save Story
A highly infectious, often fatal viral disease affecting rabbits has been detected in Utah's wildlife for the first time in four years.

Have You Seen This? Sad dog misses out on ballpark snack
Carter Williams, KSL | Posted June 23 - 3:30 p.m. | Save Story
Every dog has its day, except for this one pup who attended Monday's Miami Marlins game.

SPONSORED
Insurance reimagined: Trucordia Go brings AI-powered solutions to the forefront
Trucordia | Posted June 23 - 3:00 p.m. | Save Story
The innovative Trucordia Go technology simplifies things, with help from a virtual assistant named Trudy. Simply type your questions into the chat box and Trudy can help steer you in the right direction.

Most Viewed
- Husband charged in 2006 death of wife in Angel's Landing fall
- GOP incumbents Moore, Maloy fend off challengers; McAdams wins Democratic primary
- Human remains found in Garfield County nearly 30 years ago identified
- Utah mother charged with international kidnapping claims she was saving kids from 'end of times'
- 'We knew that this was coming': Smoke fills Utah's skies as fires continue to blaze
- Stuart Adams, Trevor Lee, Dan McCay lose reelection bids in Utah Legislature
- A highly infectious disease has been found in Utah's wild rabbit population again
- Salt Lake Temple marks milestone with reinstallation of east temple doors
- 12-year-old Colorado City boy experiencing rare, life-threatening post-transplant condition
- Here's what to watch for on primary Election Day in Utah
Markets


-DJIA--
-Nasdaq--
-S&P 500--
STAY IN THE KNOW
Get informative articles and interesting stories delivered to your inbox weekly.
Subscribe to the KSL.com Trending 5.
By subscribing, you acknowledge and agree to KSL.com's
Terms of Use
and Privacy Notice.


Features »

12-year-old Colorado City boy experiencing rare, life-threatening post-transplant condition
- A highly infectious disease has been found in Utah's wild rabbit population again
- Have You Seen This? Sad dog misses out on ballpark snack
- 'We knew that this was coming': Smoke fills Utah's skies as fires continue to blaze
- From Helicopter to 1,000-Foot Rappel: Up Lake Adventures Pushes Limits at Lake Powell
Outdoors »

A highly infectious disease has been found in Utah's wild rabbit population again
- 'We knew that this was coming': Smoke fills Utah's skies as fires continue to blaze
- From Helicopter to 1,000-Foot Rappel: Up Lake Adventures Pushes Limits at Lake Powell
- Does the Vesper Amphitheater follow Provo's hillsides and canyons preservation guidelines?
- Fireworks sales begin Wednesday amid widespread fire restrictions, active wildfire season
World »

Taiwan says warning time for any China attack is shortening
- Senate joins House in voting to halt Iran war, rebuking Trump
- Man arrested in Hungary for collecting human body parts taken from cemeteries, police say
- Officer among 2 killed in a Montreal shooting that sources say appeared to target police
- Ebola cases in Congo reach highest first-month total of any outbreak, WHO says
U.S. »
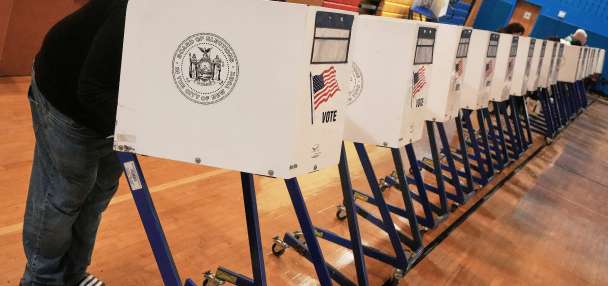
Mamdani slate sweeps Democratic primaries in New York, ousts 2 incumbents from Congress
- Olympian skier Bode Miller pleads not guilty to Idaho misdemeanor drug charges
- Leader of Texas immigration center attack gets 100-year prison sentence
- House passes affordable housing bill, sending it to Trump for enactment
- Pregnant teen murdered in 1975 identified as Cheryl Edwards of Illinois thanks to DNA genealogy
Utah »

GOP incumbents Moore, Maloy fend off challengers; McAdams wins Democratic primary
- AI cybersecurity flaw: How hackers can fool AI chatbots into handing over sensitive info
- Stuart Adams, Trevor Lee, Dan McCay lose reelection bids in Utah Legislature
- Box Elder County commissioners who voted for data center project trailing in primary voting
- Co-owners of drug treatment facility accused of defrauding Utah Medicaid
Voces de Utah »

Mike Lee pursuing bill to bolster fines on immigrants in the country illegally, their employers
- Nearly 3,000 Colombians in Utah eligible to vote in Colombia's presidential election
- Activities slated to mark World Refugee Day, celebrate mariachi music
- Proposed immigrant detention center site in Salt Lake City to be offloaded, newspaper reports
- West Valley City removes Cesar Chavez Drive signs; Ogden leaders still mulling issue

Politics »
GOP incumbents Moore, Maloy fend off challengers; McAdams wins Democratic primary
- Stuart Adams, Trevor Lee, Dan McCay lose reelection bids in Utah Legislature
- Taiwan says warning time for any China attack is shortening
- Box Elder County commissioners who voted for data center project trailing in primary voting
- Mamdani slate sweeps Democratic primaries in New York, ousts 2 incumbents from Congress
»
GOP incumbents Moore, Maloy fend off challengers; McAdams wins Democratic primary
- AI cybersecurity flaw: How hackers can fool AI chatbots into handing over sensitive info
- Stuart Adams, Trevor Lee, Dan McCay lose reelection bids in Utah Legislature
- Box Elder County commissioners who voted for data center project trailing in primary voting
- Co-owners of drug treatment facility accused of defrauding Utah Medicaid
